Learn Excel With Pivot Tables, Pivot Charts, Slicers, and Timelines
 0 Students


 14-Day Money-Back Guarantee
-
1 Year Access
 -
Beginner Skill Level
 -
Course Certificate Certificate
 -
15 Units
Units -
0 Quizzes
 -
1 hour, 21 minutes Duration


Course overview
Gain the skills to summaries large amounts of data into meaningful information with the Learn Excel With Pivot Tables, Pivot Charts, Slicers, and Timelines course. In this course, you will develop a comprehensive understanding of the PivotTable and PivotChart and explore how they work.
In this Learn Excel With Pivot Tables, Pivot Charts, Slicers, and Timelines course, you will learn the steps to create your Pivot table and Pivot chart. We’ll show you how to use Pivot tables to summarize large amounts of data. You’ll also learn how to use PivotChart to provide visual representation to your summarized data. We will then take you through adding sorts, filters, timelines and slicers to create dynamic dashboards. You will also learn how to use the slicer to slice and dice your data the way you want.
Learning outcomes
- Learn how to summaries data with Pivot Table
- Be able to add graphical representation to your summarized data with PivotChart
- Learn how to update the Pivot Table with new data
- Deepen your understanding of sorting and filtering
- Be able to import data from various sources with Power Query
- Gain an excellent understanding of Power Pivot
Who is this course for?
Professionals who want to learn how to summaries large sums of data into meaningful information using Excel Pivot and Charts can take this course. The program will provide learners with in-demand knowledge and skills, allowing them to take advantage of outstanding employment opportunities.
Entry Requirement
- This course is available to all learners, of all academic backgrounds.
- Learners should be aged 16 or over to undertake the qualification.
- Good understanding of English language, numeracy and ICT are required to attend this course.
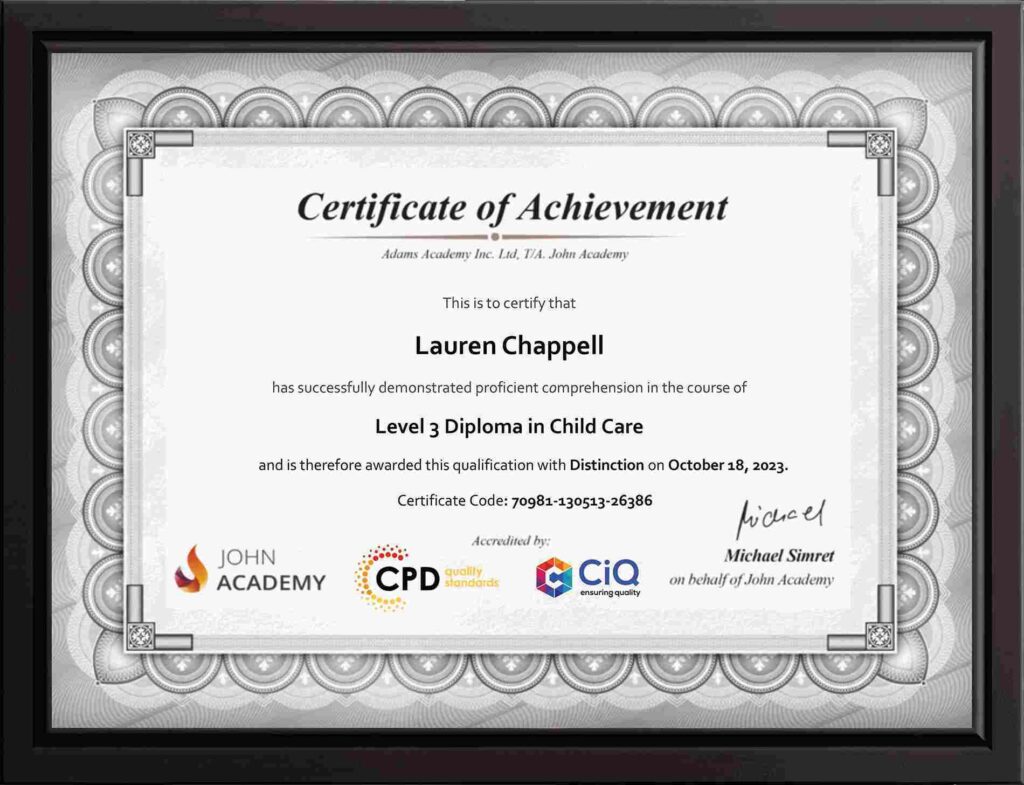
Certification
- After you have successfully completed the course, you will be able to obtain an Accredited Certificate of Achievement. You can however also obtain a Course Completion Certificate following the course completion without sitting for the test. Certificates can be obtained either in hardcopy at the cost of £39 or in PDF format at the cost of £24.
- PDF certificate’s turnaround time is 24 hours, and for the hardcopy certificate, it is 3-9 working days.
Why choose us?
- Affordable, engaging & high-quality e-learning study materials;
- Tutorial videos/materials from the industry-leading experts;
- Study in a user-friendly, advanced online learning platform;
- Efficient exam systems for the assessment and instant result;
- The UK & internationally recognized accredited qualification;
- Access to course content on mobile, tablet or desktop from anywhere anytime;
- The benefit of career advancement opportunities;
- 24/7 student support via email.
Career Path
The Learn Excel With Pivot Tables, Pivot Charts, Slicers, and Timelines course provides essential skills that will make you more effective in your role. It would be beneficial for any related profession in the industry, such as:
- Data Analyst
- Accountants
- Financial Analyst
-
 Getting started with your Pivot Table 00:04:00
 -
Drill Down 00:01:00
-
Managing the Field List 00:02:00
-
Changing the Calculation type with Value Field Settings 00:06:00
-
Growing your Pivot Table with Multiple Fields 00:04:00
-
Formatting the Pivot Table 00:05:00
-
Sorting and Filtering the Pivot Table 00:03:00
-
Creating a Dashboard with Slicers, Timelines and Pivot Charts 00:09:00
-
Reporting by day, month, qtr, or year within the Pivot Table 00:04:00
-
Refreshing the Pivot Data with new data 00:03:00
-
Adding your own calculations into the Pivot Table 00:03:00
-
The power of the Filter Section in the Pivot Table 00:04:00
-
PowerQuery 00:12:00
-
PowerPivot 00:21:00
-
Order Your Certificates and Transcripts
What Our Students are Saying

Sam Carpenter
John Academy has helped me in my development, and I took the courses seriously and gained a qualifications certificate, which I've wanted to do for a long time. I highly recommend it, and a few friends have signed up, too. Thank you, John Academy.
Georgina Salazar
Easy to access, generous options for multiple learning and approaches. Supportive team.
Wayne Wright
The course empowers me to make my dreams come true. The course material was excellent. John Academy is good to study.
Romina
I am thankful that I have chosen John Academy for my online courses. It has given me a platform where I have learned a lot. It has so many reading materials with a handful of knowledge. Once again, thank you so much to the John Academy support team, who has cooperated & supported me throughout this journey.
Peter Gilbert
Brilliant course, with so many to choose from, very good value and a certificate at the end. Quick turnaround to receive a certificate. Very good academy I have completed several and have 2 ongoing at the moment. Never had any problems. Excellent customer service. Would recommend.