In the age of information overload, infographics have emerged as a beacon of clarity, transforming complex data into visual narratives that are both engaging and easily digestible.
These visual tools leverage the human brain’s innate ability to process images faster than text, providing a powerful means to communicate ideas, trends, and data in an instant.
Whether for marketing, education, or data presentation, infographics cut through the noise, offering a succinct and attractive way to share knowledge and insights.
Definition and Explanation of an Infographic
Infographics simplify complex information by blending text, images, and design elements like charts. They enhance comprehension by presenting narratives concisely.
The roots of infographics date back to ancient civilizations and evolved from 17th-century graphics. In today’s digital age, they are prevalent in online content, communicating insights effectively. Infographics streamline data, aiding understanding and retention.
By highlighting key details and trends, infographics simplify complex information for easier understanding and retention. If you’re unsure aboutwhat’s an infographic and the creation, let’s explore further!
Why Use Infographics?
Infographics present considerable benefits across multiple fields, such as marketing and education. They have the ability to transform data and processes into engaging and understandable visuals, enhancing interaction and facilitating information retention.
Within marketing, infographics possess the capacity to elevate brand visibility and enhance SEO, as visually appealing content tends to be shared more frequently.
In educational contexts, they aid learning by catering to visual learners and dismantling educational obstacles. They reduce information overload and increase comprehension, leading to increased retention.
By using infographics, you can capitalize on the power of visual aids to enhance your content’s reach and impact.
The 9 Types of Infographics
From listicles to interactive designs, infographics come in various formats, each suited to different types of information and storytelling needs:
Listicle Infographics
Listicle infographics present data in a list format, with each point accompanied by corresponding imagery. They’re ideal for presenting information in an entertaining and digestible manner.
Comparative Infographics
Comparative infographics juxtapose data to highlight similarities and differences between different categories or groups. They’re especially useful for comparing products, services, or processes, and are easily customizable depending on your specific needs.
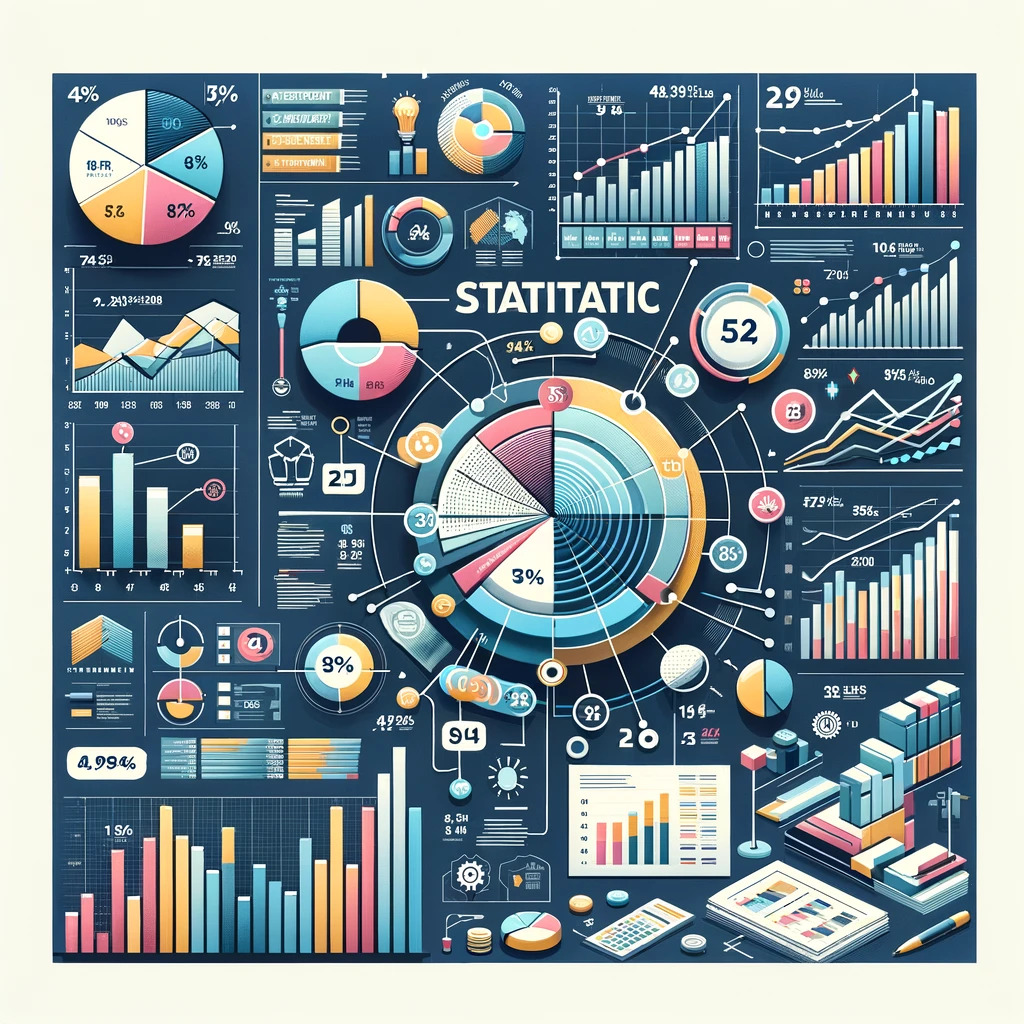
Statistical Infographics
Statistical infographics display data in a visually appealing way, often using charts, graphs, and other data visualization techniques. They are particularly effective for presenting large sets of numerical data and making complex information more accessible.
Process Infographics
Process infographics use a step-by-step approach to visually explain a process or procedure. They are great for presenting instructions, guidelines, and procedures in a concise and engaging manner.
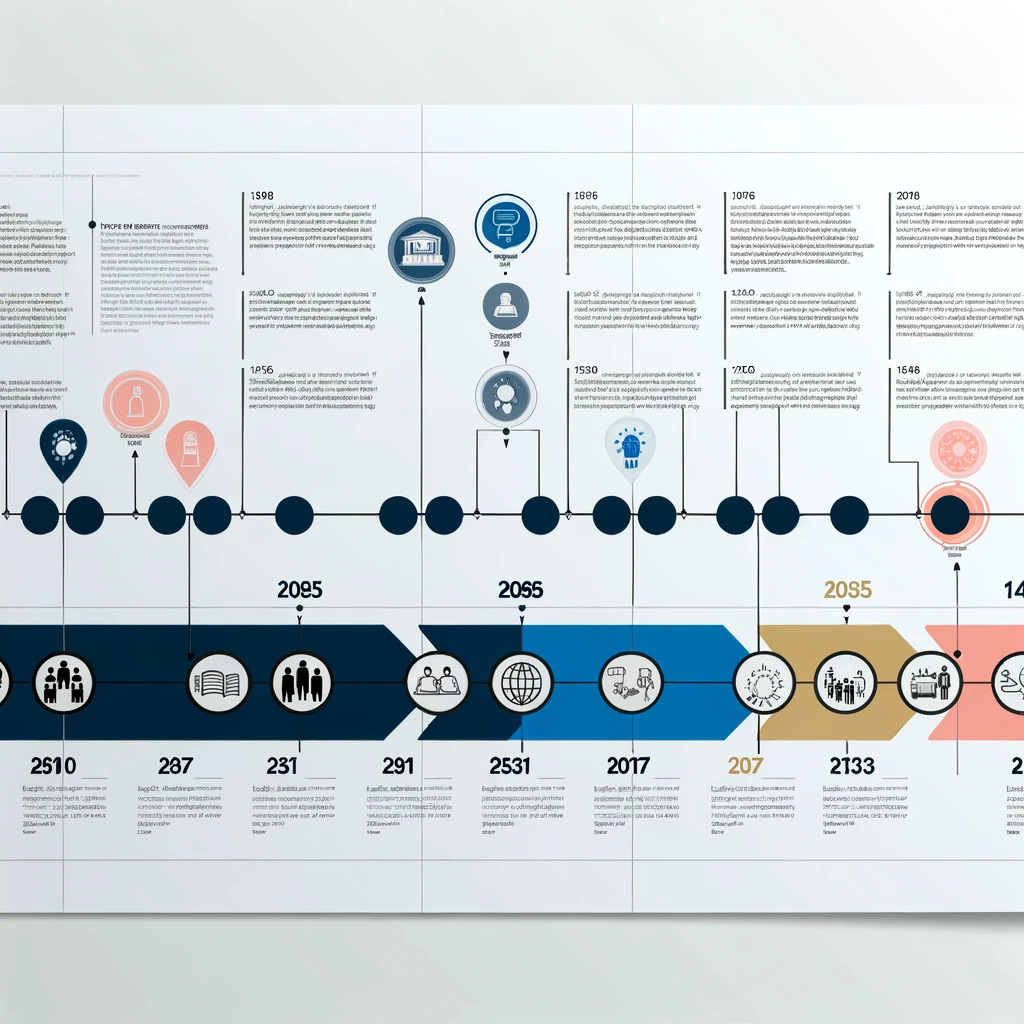
Timeline Infographics
Timeline infographics present information chronologically, making it easy to track the progression of events or trends. They’re ideal for showing historical data, milestones, and timelines of projects or processes.
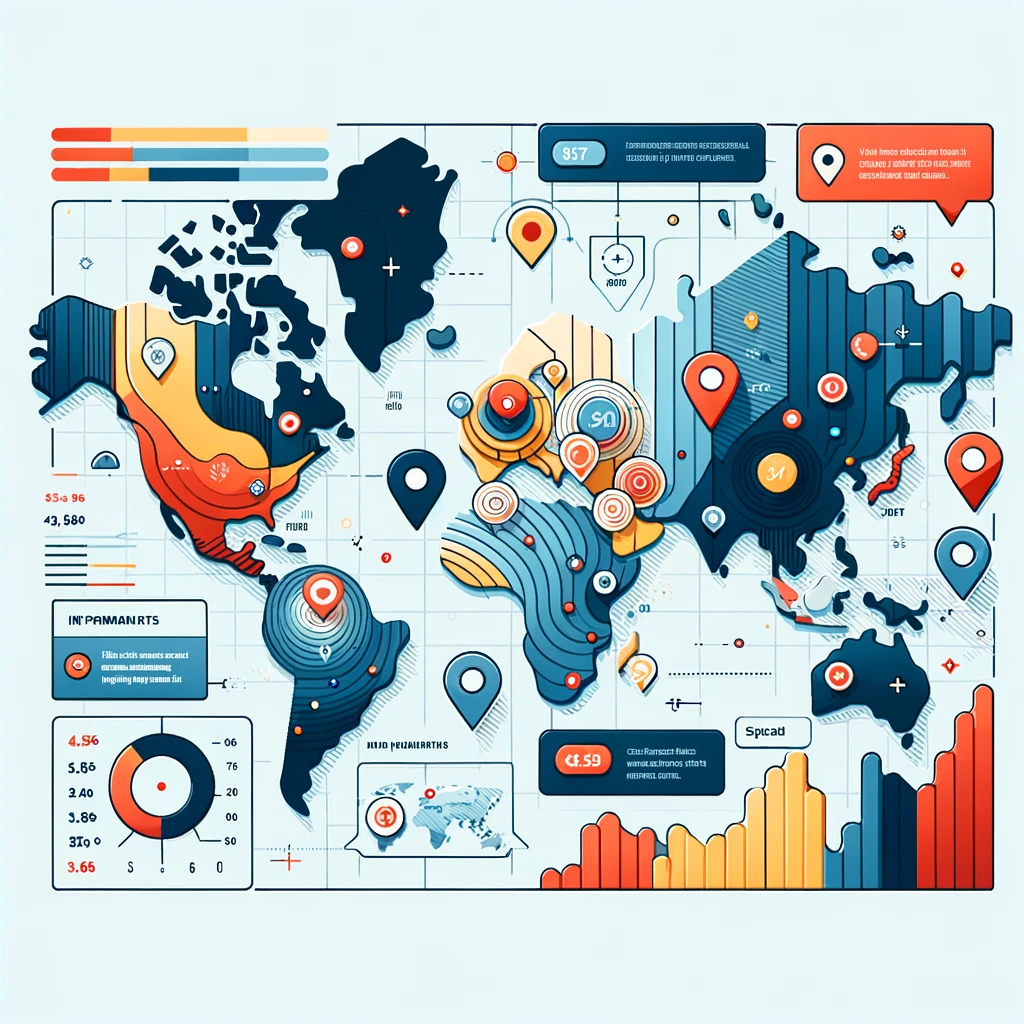
Geographic Infographics
Geographic infographics use maps and other geographical data to visually represent information related to specific locations or regions. They’re especially helpful for presenting demographic data, population trends, and other location-specific information.
Hierarchical Infographics
Hierarchical infographics use a hierarchical structure to present information in a clear and organized manner. They’re great for visualizing relationships, hierarchies, and structures within an organization or industry.
Informational Infographics
Informational infographics are used to present data or information in a clear and concise manner. They’re helpful for summarizing complex information, comparing different sets of data, or presenting statistics and key facts.
Interactive Infographics
Interactive infographics allow for user engagement and interaction, making them a popular choice for online content. They can include features such as clickable elements, animations, picture moving effect and scrolling effects to enhance the user experience.
Each type serves a unique purpose, catering to specific informational needs and audience preferences.
How to Create an Infographic
Now that you understand what an infographic is and the various types available, let’s explore how to create one.
5 Steps To Create an Infographic:
Define Your Objective: Understand what you want to achieve.
Research and Gather Data: Collect accurate and relevant information.
Choose the Right Type: Select the infographic format that best fits your data.
Design: Use online free tools or free templates like Adobe Expres to bring your infographic to life, focusing on clarity, consistency, and visual appeal.
Review and Refine: Ensure the information is accurate and the design is engaging.
A high-quality infographic is defined by its clarity, precision, and visual attractiveness. It must convey information in an engaging and easily comprehensible manner. To enhance its effectiveness, steer clear of typical errors like overwhelming data, deceptive visuals, or disrupting the narrative flow.
Conclusion
In conclusion, infographics are powerful visual tools that, when executed properly, can significantly enhance communication and engagement. By combining the right blend of data, design, and storytelling, infographics have the potential to present complex information succinctly and memorably.
Remember, the effectiveness of an infographic is not just in its aesthetic appeal but in its ability to facilitate understanding and retention among its audience.
Whether you’re a marketer, educator, or student, mastering the art of creating infographics is a valuable skill in the digital age where visual content reigns supreme. If you’re interested in venturing into entrepreneurship, exploring the best small business ideas for 2024 can set you on the path to success.
No more than 50 active courses at any one time. Membership renews after 12 months. Cancel anytime from your account. Certain courses are not included. Can't be used in conjunction with any other offer.